Bitcoin Market Indicators: Navigating the Future of Digital Assets
The approval of the first Bitcoin spot ETFs marks a pivotal moment in financial history, opening the floodgates for institutional capital and redefining how traditional markets interact with digital assets. This milestone paves the way for wealth managers, pension funds, and institutional investors to gain regulated exposure to Bitcoin, setting the stage for a broader adoption of cryptocurrency-based financial products.
However, with Bitcoin now embedded within traditional finance, understanding its market trends and indicators has never been more crucial. In this report, we explore key Bitcoin market indicators that provide deep insights into price movements, market cycles, investor sentiment, and miner behavior - essential knowledge for navigating the evolving digital asset landscape.
Useful Resource: Bitcoin Price Prediction with Scale Invariance, and the Power Law
Key Bitcoin Market Indicators
1. Price Trend Indicators
Moving Averages: Spotting Market Trends
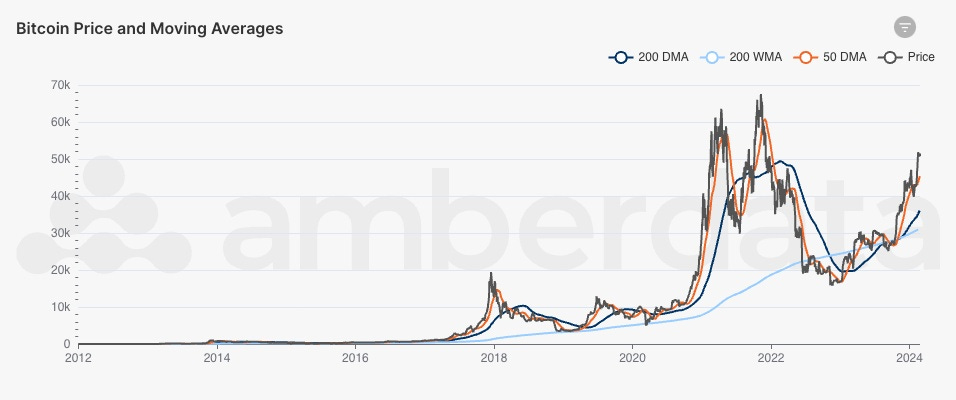
Bitcoin’s 50-day moving average (50DMA) and 200-day moving average (200DMA) offer insight into price trends.
When the 50DMA falls below the 200DMA (Death Cross), it signals potential weakness.
Conversely, when the 50DMA moves above the 200DMA (Golden Cross), it suggests bullish momentum.
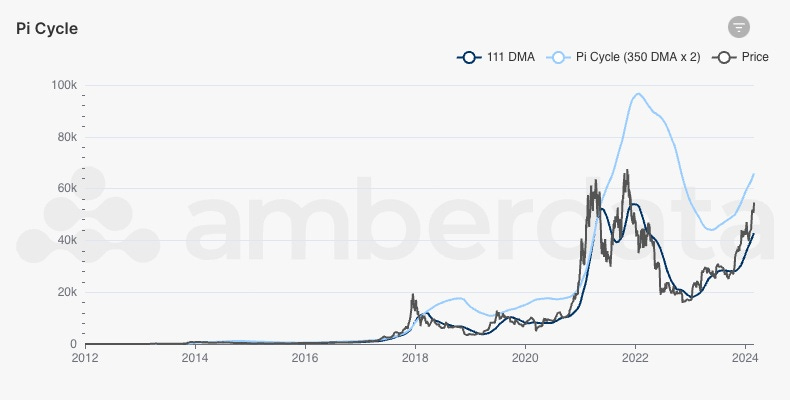
Pi Cycle Top Indicator: Predicting Market Peaks
This indicator compares Bitcoin’s 111-day moving average (111DMA) with a 2x multiple of the 350-day moving average (350DMA x2). Historically, when the 111DMA crosses above the Pi Cycle, Bitcoin reaches euphoric price peaks—highlighting potential overvaluation.
Stock-to-Flow Model: Measuring Scarcity
The stock-to-flow (S2F) ratio quantifies Bitcoin’s scarcity by comparing its existing supply (stock) to its new annual issuance (flow). Similar to gold, Bitcoin’s predictable halving events increase its S2F ratio over time, driving its value appreciation.
2. Market Cycle Indicators
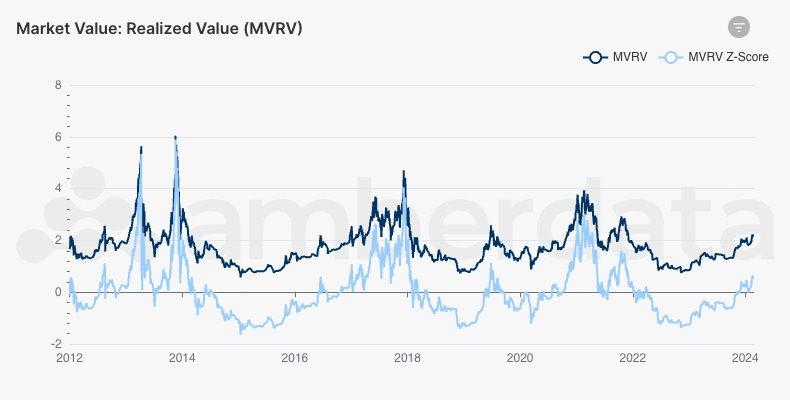
MVRV Z-Score: Identifying Market Tops and Bottoms
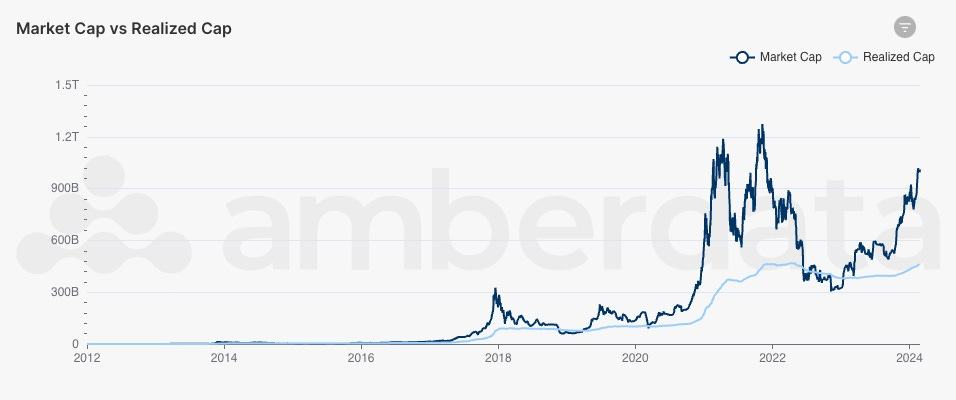
MVRV compares Bitcoin’s market cap to its realized cap (total value of coins based on last transaction price).
High MVRV Z-scores indicate potential price tops, while low scores signal undervaluation and buying opportunities.
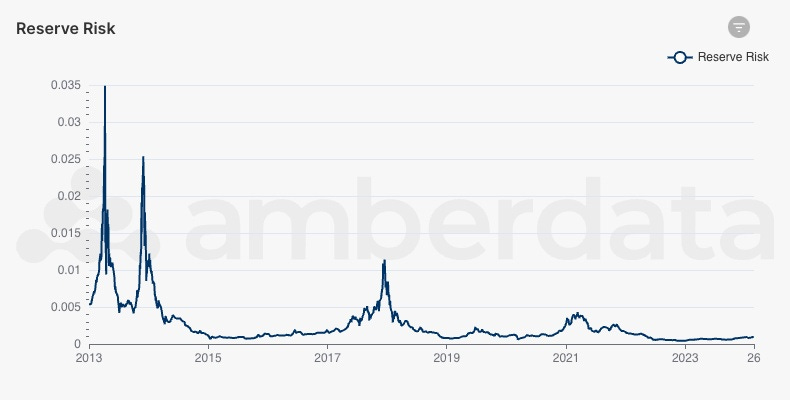
Reserve Risk: Tracking Long-Term Holder Sentiment
A low reserve risk suggests strong conviction from long-term holders (HODLers) and a favorable accumulation phase.
A high reserve risk implies excessive market speculation, often preceding corrections.
Realized Cap vs. Market Cap: Network-Wide Profitability
When market cap > realized cap, Bitcoin holders are in aggregate profit, indicating market exuberance.
When realized cap > market cap, holders are in aggregate loss, often signaling cycle bottoms.
3. Investor Sentiment Indicators
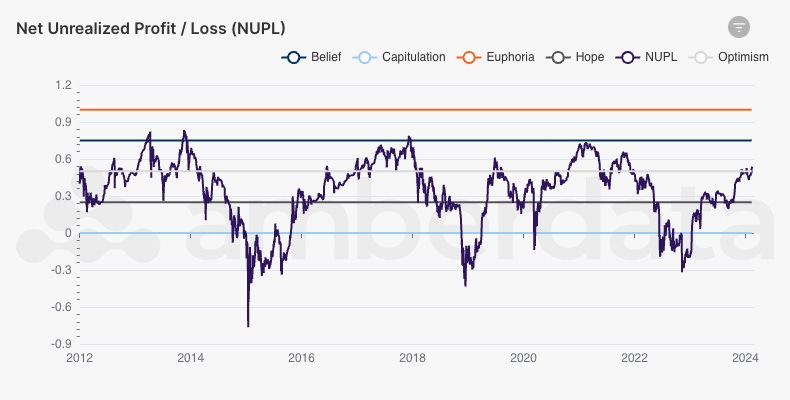
Net Unrealized Profit/Loss (NUPL): Gauging Market Emotions
High NUPL (>0.75) suggests a market in euphoria, often preceding corrections.
Low NUPL (<0.25) indicates fear and market undervaluation—historically good accumulation zones.
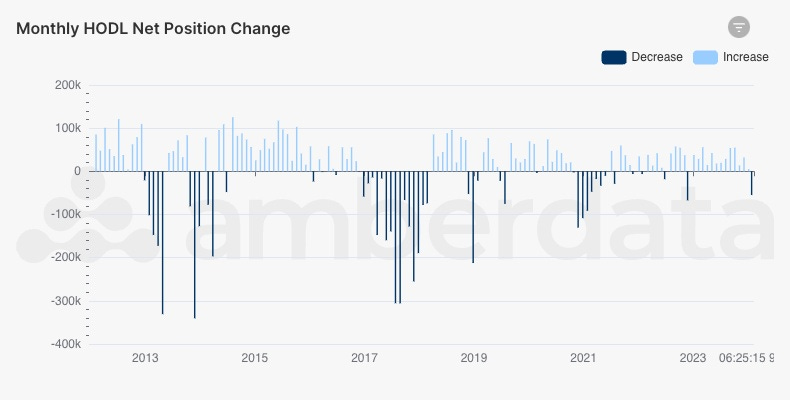
HODLer Net Position Change: Long-Term Holding Trends
Increasing HODLer positions suggest accumulation, common in bear markets.
Decreasing HODLer positions indicate distribution, often during bull market peaks.
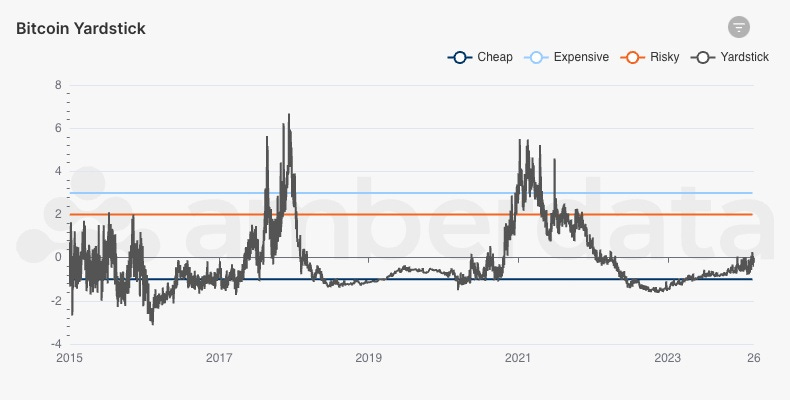
Bitcoin Yardstick: The Network’s "P/E Ratio"
A low Bitcoin Yardstick value signals undervaluation.
A high value suggests Bitcoin may be expensive relative to its energy security.
4. Miner Behavior Indicators
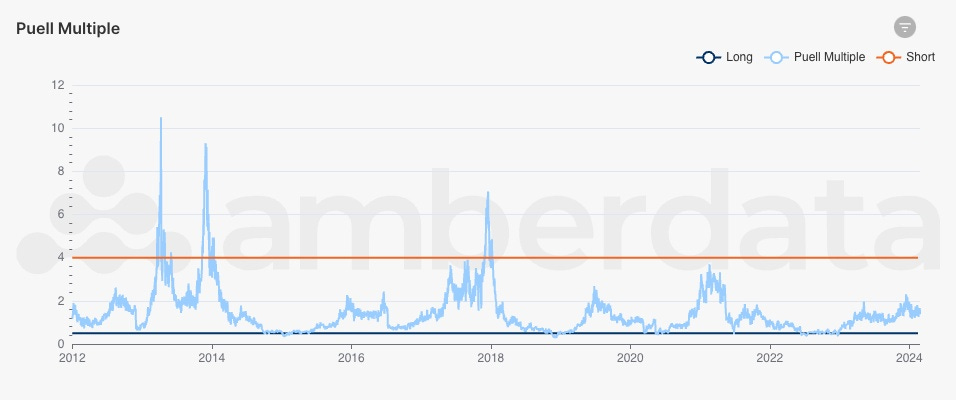
Puell Multiple: Measuring Miner Profitability
High Puell Multiple (>4.0-8.0) signals overheated miner profits, often coinciding with cycle peaks.
Low Puell Multiple (<0.6) suggests miner capitulation, typically seen near market bottoms.
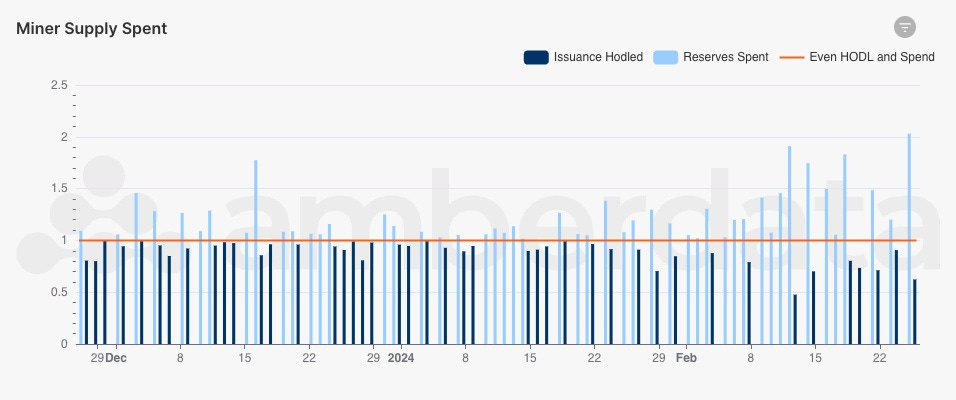
Miner Supply Change: Monitoring Selling Pressure
High miner selling pressures price downward.
Low miner selling indicates miner confidence in Bitcoin’s future price appreciation.
5. Network Activity Indicators
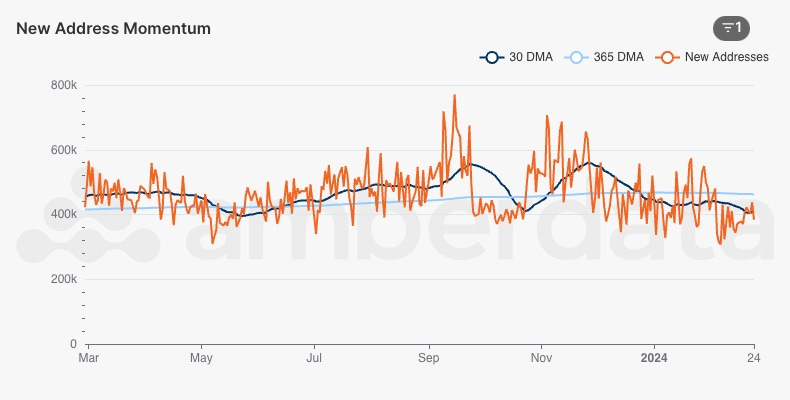
Active Addresses & New Address Momentum
Growing active addresses signal increasing adoption and usage.
New address momentum tracks whether short-term activity is outpacing long-term network growth.
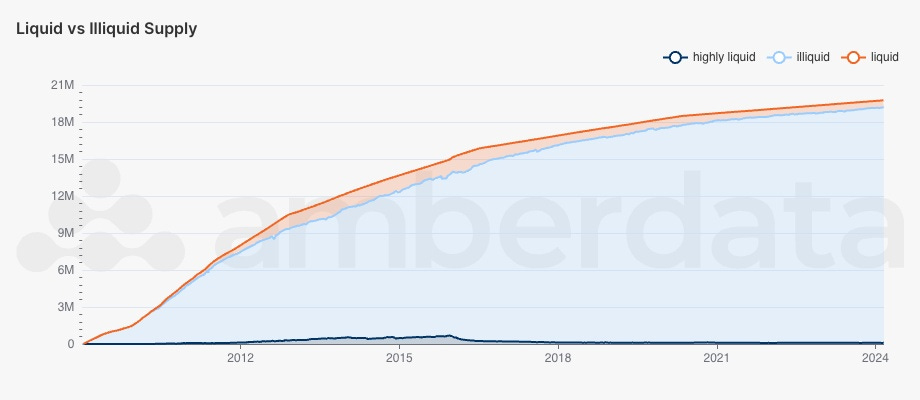
Liquid vs. Illiquid Supply: Understanding Supply Dynamics
Illiquid supply growth (held by HODLers) reduces sell pressure and supports long-term appreciation.
Highly liquid supply increases short-term volatility as coins move between traders.
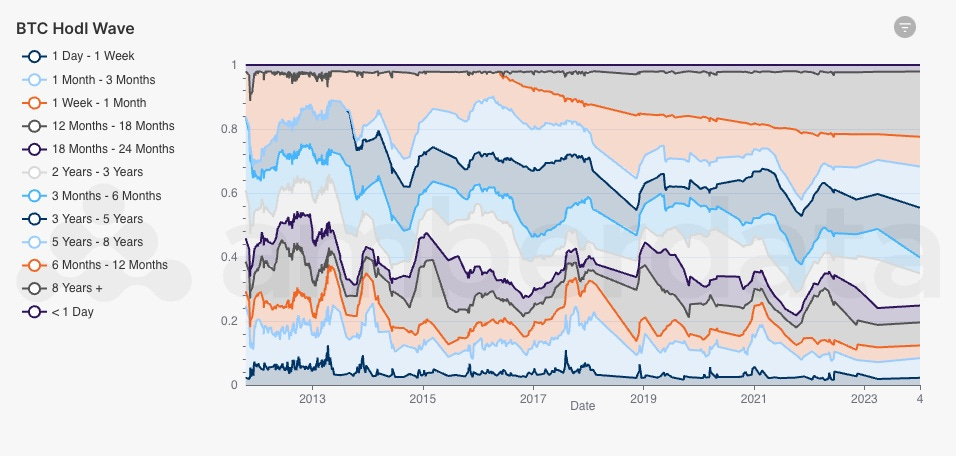
HODL Waves: Tracking Holding Patterns
Short-term HODL waves spike during bull runs as holders sell for profits.
Long-term HODL waves grow in bear markets, reflecting strong conviction from seasoned investors.
Conclusion: Bitcoin as a Market Force
As Bitcoin integrates into mainstream finance via ETFs and institutional adoption, understanding its market dynamics is essential. These key indicators provide a comprehensive framework for evaluating Bitcoin’s price trends, investor sentiment, and network health, helping institutions and investors make data-driven decisions.
By leveraging these insights, investors can navigate Bitcoin’s volatility, identify market opportunities, and position themselves strategically in the evolving digital asset landscape.
🔍 What are your thoughts on Bitcoin’s market indicators? Which ones do you rely on most? Let’s discuss in the comments! 🚀 #Bitcoin #CryptoMarkets #InstitutionalAdoption
========
The Crypto Code.
Learn “How Joel and Adam Have Made Up To $800 Per Day In Totally Automated Crypto Profits, With a Secret Software Tool that Works Fast and Profits Consistently Whether the Market is Up or Down!”
This week Joel & Adam will be running a live workshop with a few close friends of mine who will be revealing a counterintuitive, 5-step method for generating profit in crypto without staring at charts all day, doing a ton of research, or trying to time the market. In fact…
You don’t actually have to do ANY crypto trading yourself. This system runs on TOTAL AUTOPILOT and the best part is that it works whether the market is up or down.
Join The CRYPTO CODE Mastermind ⏩
=====================
Token Metrics Lets You Identify Hidden Crypto Gems Through Research & AI
Token Metrics is changing the game for crypto traders with its AI-powered price predictions and trading suggestions. Eliminate the guesswork to act fast and grab those lucrative opportunities with the platform’s data API, analytics, and AI chatbot! Learn more here.


